



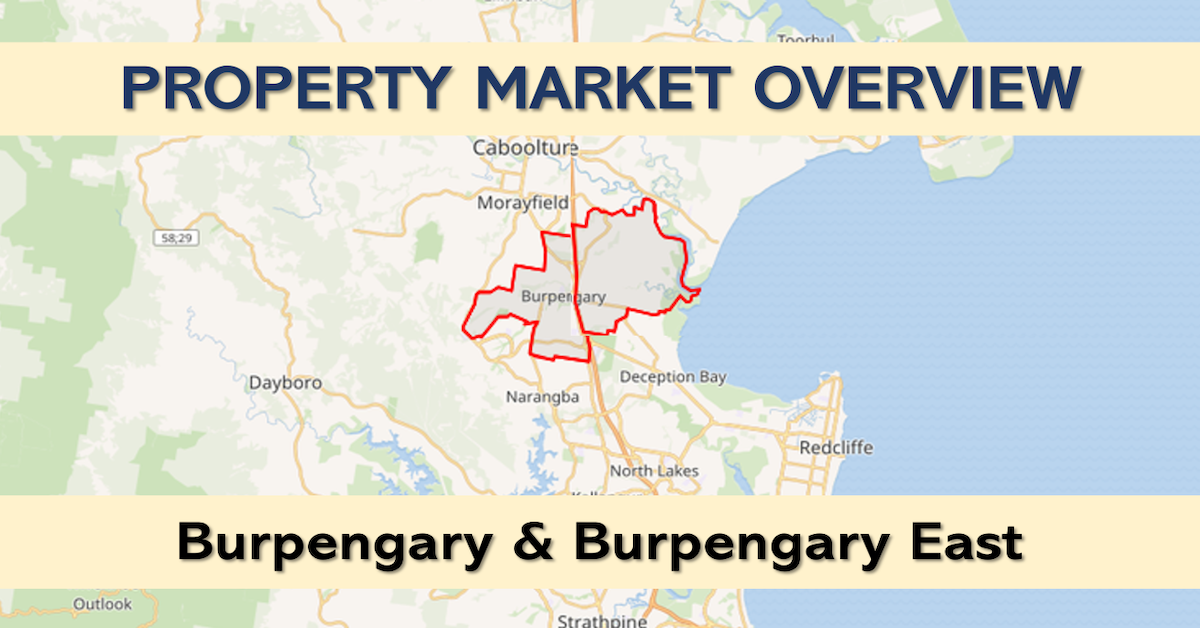
Burpengary and Burpengary East have both recorded lower median house prices over the latest three-month period compared with their 12-month medians, but the figures tell a more complicated story than a straightforward fall in property values.
The latest Property Market Overview, covering transactions to 18 October 2026, puts Burpengary’s three-month median house price at $945,000, compared with $971,000 over the past 12 months. In neighbouring Burpengary East, the corresponding figures were $1,010,000 and $1,099,500.
That represents a difference of 2.7 per cent in Burpengary and 8.1 per cent in Burpengary East. However, these are medians calculated from different groups of properties sold, rather than evidence that individual homes have lost the same percentage of their value.


For buyers and sellers looking at the two suburbs, the more revealing figures may be how long houses are taking to sell and the types of properties changing hands.
Burpengary and Burpengary East at a Glance
Burpengary vs Burpengary East — At a Glance
| Suburb | House Median | Homes Sold | Days to Sell |
|---|---|---|---|
| Burpengary | $945,000 | 64 | 27 |
| Burpengary East | $1,010,000 | 47 | 41 |
Three months to 18 October 2026. Homes sold includes acreage. House medians exclude acreage; days to sell applies to houses.


Across the latest three months, Burpengary recorded 64 residential sales, including acreage properties, while Burpengary East recorded 47.
Burpengary’s three-month median house price was $65,000 below that of Burpengary East. The difference reflects two distinct local housing markets, with Burpengary East’s larger residential blocks and acreage properties contributing to a different mix of sales.
Houses Are Taking Longer to Sell
One of the clearest changes in both suburbs is the time properties are spending on the market.
In Burpengary, houses took a median of 27 days to sell over the latest three months, compared with 15 days across the past 12 months. Around 41 per cent took at least 30 days to sell, compared with 29 per cent over the longer period.


The difference was more pronounced in Burpengary East, where the median selling period increased from 20 days over 12 months to 41 days in the latest quarter.
Around two-thirds of houses sold in Burpengary East during the latest period took 30 days or longer to find a buyer.
These figures suggest buyers are taking more time to make decisions, although they do not establish whether individual properties have required price reductions.
Why Burpengary East’s Median Needs a Closer Look
Burpengary East’s 8.1 per cent difference between its three-month and 12-month house medians appears substantial, but the mix of homes sold provides important context.
Fewer houses on larger blocks changed hands in the latest period. Among houses on blocks smaller than 1,000 square metres, the three-month median was $972,500, compared with $990,000 over the past 12 months.
That is a considerably narrower difference than the overall house median suggests.
A suburb’s median can move when the proportion of higher-priced or lower-priced properties changes, even without a comparable movement in the value of individual homes.
Burpengary East also recorded five acreage sales over the latest three months, with prices ranging from $905,000 to $2 million. Acreage properties are reported separately from standard houses in the overview.
What Different Bedroom Counts Are Selling For
Four-bedroom houses accounted for the largest share of standard house sales in both suburbs during the latest three-month period.
In Burpengary, 25 four-bedroom houses sold at a median of $961,000, compared with a 12-month median of $977,500.
Three-bedroom houses recorded a three-month median of $875,000, while five-bedroom houses recorded $1.1 million. Both figures were based on fewer than 10 sales, making them more sensitive to individual transactions.
House Prices by Bedroom Count
| Beds | 3-Mo Median | 12-Mo Median |
|---|---|---|
| 3 | $875,000 † | $897,000 |
| 4 | $961,000 | $977,500 |
| 5 | $1,100,000 † | $1,210,000 |
Houses on blocks up to 4,000 m². † Based on fewer than 10 sales. — Too few sales to show a three-month median.
In Burpengary East, 27 four-bedroom houses sold at a three-month median of $1,020,000, compared with $1,099,000 over the past 12 months.
There were too few three-, five- and six-bedroom house sales in the latest period to publish reliable three-month medians for those categories.
House Prices by Bedroom Count
| Beds | 3-Mo Median | 12-Mo Median |
|---|---|---|
| 3 | — | $940,000 |
| 4 | $1,020,000 | $1,099,000 |
| 5 | — | $1,500,000 |
| 6 | — | $1,700,000 † |
Houses on blocks up to 4,000 m². † Based on fewer than 10 sales. — Too few sales to show a three-month median.
Townhouses, Units and Acreage
Burpengary’s townhouse and unit market recorded a three-month median of $682,500, compared with $693,000 over the past 12 months.
In Burpengary East, only two townhouse or unit sales were recorded during the latest period, at $680,000 and $690,000. That is too small a sample to draw meaningful conclusions about the direction of prices.
Acreage sales also form an important part of the local picture.
Four acreage homes sold in Burpengary during the latest three months, ranging from $1.25 million to $2.8 million. In Burpengary East, five acreage transactions ranged from $905,000 to $2 million.
These larger properties can command significantly different prices from homes on conventional residential blocks, which is why the overview separates acreage from standard house medians.
The Highest-Priced Sales
The most expensive recorded residential sale in Burpengary during the reporting period was 84 Gleeson Road at $2.8 million. Other notable transactions included 8 Osborne Drive at $1.7 million and 55–59 Canopy Place at $1.6 million.
In Burpengary East, 119 Cobb Road topped the list at $2.35 million, followed by 24 Margaret Street at $2 million and 69 Northwood Drive at $1,944,100.
The highest-priced transactions include properties with characteristics that may differ considerably from typical suburban homes, so they should not be treated as representative of the wider market.
Highest Recorded Sales — Three Months to 18 October 2026
Top 10 Sales
| Address | Bed | Bath | Price |
|---|---|---|---|
| 84 Gleeson Rd | 3 | 1 | $2,800,000 |
| 8 Osborne Dr | 4 | 2 | $1,700,000 |
| 55-59 Canopy Pl | 5 | 3 | $1,600,000 |
| 85-87 Rosehill Dr | 4 | 2 | $1,350,000 |
| 108 Coutts Dr | 3 | 1 | $1,300,000 |
| 46-48 Chestnut Dr | 5 | 2 | $1,284,000 |
| 33 Hawthorn Rd | 4 | 2 | $1,250,000 |
| 3 Copland Ct | 4 | 2 | $1,150,000 |
| 1 Bandt Cl | 5 | 2 | $1,138,119 |
| 153 Pitt Rd | 4 | 2 | $1,120,000 |
Top 10 Sales
| Address | Bed | Bath | Price |
|---|---|---|---|
| 119 Cobb Rd | 6 | 3 | $2,350,000 |
| 24 Margaret St | 5 | 4 | $2,000,000 |
| 69 Northwood Dr | 4 | 3 | $1,944,100 |
| 2 Pincushion Lane | 4 | 2 | $1,918,300 |
| 283 Uhlmann Rd | 4 | 2 | $1,850,000 |
| 35 Roseberry Pl | 4 | 3 | $1,725,000 |
| 198 Coach Road East | 4 | 3 | $1,550,000 |
| 76 Fraser Dr | 5 | 5 | $1,500,000 |
| 63 Brook Cres | — | — | $1,420,000 |
| 50 Moore Rd | 6 | 3 | $1,350,000 |
Includes acreage. A dash indicates information not supplied in the source dataset. Addresses and agent details reflect the reconciled report.
What the Figures Mean for Buyers and Sellers
The latest results point to a market in which houses are generally taking longer to sell, while differences in the types of properties sold continue to influence suburb-wide median prices.
For sellers, the longer selling periods underline the importance of realistic pricing and understanding how comparable homes have performed.
For buyers, the figures provide a useful starting point, particularly when comparing properties with similar bedroom counts, land sizes and locations.
The full Property Market Overview includes monthly median price trends, detailed selling-period comparisons, bedroom breakdowns and the top 10 recorded sales for each suburb.
Explore the Full Property Market Overview
See the complete Burpengary and Burpengary East comparison, including monthly price charts, selling times, bedroom breakdowns and the top 10 sales in each suburb.
Publication: Moreton Bay Area Properties
View the Full Property Market Overview →Property market figures cover the three months and 12 months to 18 October 2026. Medians describe the properties sold during each reporting period and do not measure changes in individual property values. Some transactions use estimated settlement dates. Figures are indicative and are not property valuations or financial advice.
Published 23-Oct-2026
CLICK ANY LOGO TO SEE PUBLICATION